
February 2018


Asia: Leaders and Laggards
Ken Peng, Investment Strategist - Asia
Kris Xippolitos, Global Head of Fixed Income Strategy
With moderating regional growth, we prefer markets with reasonable valuations and improving fundamentals.
The growth story in Asia continues - figure 1. Citi Research believes that GDP may expand by almost 6% in 2018, while inflation may pick up to around 2.6%, but remain moderate owing to the strengthening of regional currencies. Given expected growth, good corporate earnings prospects, and modest inflation, we recommend that investors continue to increase allocations to selective emerging market (EM) fixed income and equities.
The China story evolves under Xi
China’s cyclical expansion remains strong, allowing for further policy tightening in 2018. The country tightened monetary and regulatory policy in 2017, which squeezed out shadow financing, redirected credit demand back to the banking sector, and pushed up interest rates. This has been helpful for banks and insurers, and in turn for financial stability.
The central bank is likely to remain hawkish in the near term, while growth remains solid. It also aims to contain the pace of debt build-up, but does not intend to enforce deleveraging dogmatically. If the economy slows further, there is scope to ease monetary policy. This makes us more comfortable that China can achieve growth of about 6.5% in 2018.
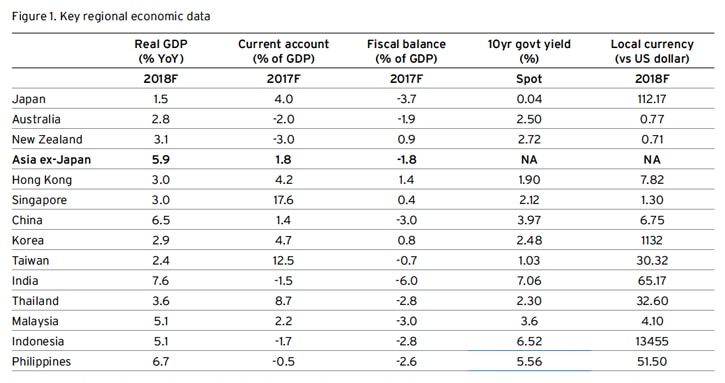
Source: Bloomberg, Citi Research, as of 24 Nov 2017. All forecasts are expressions of opinion and are subject to change without notice and are not intended to be a guarantee of future events. Note: 10-year yields are actually 5-year yields for HK, Malaysia and Philippines.
We also see less Chinese political risk after President Xi solidified his core leadership position at October 2017’s 19th Party Congress. There is a high probability that he may continue as leader after his second five-year term ends in 2022. We expect moves towards more inclusive urbanization to lift the incomes of rural and migrant households, which could further increase domestic consumption. We also look for ongoing efforts to reduce industrial overcapacity. Greater financial liberalization should enable more foreign capital to flow into Chinese onshore equities and fixed income, as well as directly into businesses.
And outside of China…
While reforms caused some pain to India in 2017, their benefits may begin to be felt in 2018. The implementation of the goods and service tax caused disruptions to the economy, but activity is now returning to normal. The government also announced plans to recapitalize the public banks, initiate a 6.9tn rupee ($106bn) infrastructure investment program, and deploy fiscal resources to stimulate rural income and consumption. The 2.1tn Indian rupee ($32bn) recapitalization is equivalent to more than 40% of the market capitalization of the publicly listed banks and is an important source for credit supply for proposed infrastructure projects, which aim to build 83,000km of roads over five years. While successful execution will be needed, we believe that the stage is set for growth potentially to return to above 7% in late 2017.
Despite facing near-term hurdles, Indonesia continues to offer a longer-term opportunity, driven by urbanization and industrialization potential. Investment growth is picking up to offset weakness in government spending and exports. Similar to India, the next stage of development depends on the authorities’ ability to implement infrastructure investment. Ahead of the 2019 election, there could be further fiscal spending to fuel the economy. Growth may remain very close to 2017 levels at 5.1%, according to Citi Research. The Indonesian rupiah has performed less strongly than other regional currencies during rallies against the dollar, and also fared worse during the dollar’s late-2017 rebound. This creates a challenge for tactical investors in Indonesia.
Japan may register another year of modest economic growth in 2018, assisted by a fiscal stimulus program and the build-up to the 2020 Olympic Games. Beyond then, structural issues including a rapidly aging population, persistently low return on equity, and a further hike in the consumption tax expected in October 2019 reduce our confidence in Japan’s longer-term prospects.
Equities
EM Asian equities performed strongly in 2017, achieving a price gain of 33% in US dollar terms. Regional currency appreciation against the weakening US dollar was a contributor. Earnings growth and multiple expansion played a greater role. Earnings for Asia Pacific ex-Japan in 2017 is estimated to have increased by 23%, ahead of expectations. Even after the 2017 rally, Asia ex-Japan, ex-Australia, and ex-New Zealand trades at 13 times consensus 2018 earnings – figure 2, just slightly above the historical average. Based on 10-year average earnings, Asia ex-Japan still trades at a below-average valuation - figure 3.
The equity performance contribution from earnings multiple expansion was largest in China. Growth sectors were the main drivers of this re-rating, as IT and real estate rallied thanks to the boom in e-commerce and the housing market. As growth expectations moderate in 2018, there may be some rotation in performance. We believe that financials, and particularly banks, could potentially outperform - figure 4, as non-performing loans fall and net interest margins widen. Chinese banks still trade at 0.9 times book value even after this year’s rally, while regional EM banks outside China trade at 1.3 times. We expect this gap to narrow in the coming year.
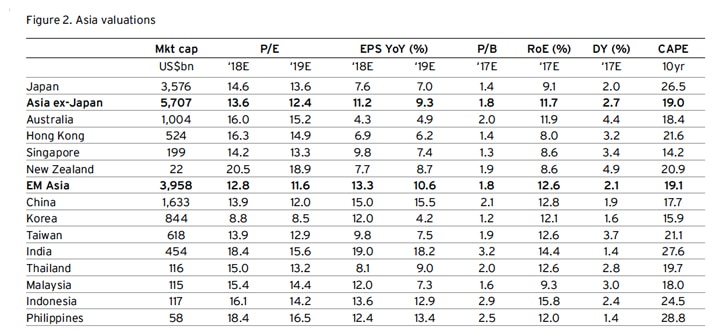
Source: Factset Consensus, MSCI, as of 24 Nov 2017. Note: The above data are compiled based on companies in MSCI AC World Index. Free MC is free float adjusted market capitalization for regions, markets and sectors. P/E (Price/Earnings), EPS growth (Earnings per share), P/B (Price/Book), Dividend yield (DY) and RoE (Return on Equity) are aggregated from Factset consensus estimates. *CAPE stands for Cyclically Adjusted Price to Earnings, and is defined as: Current price/10-year average inflation adjusted EPS. Indices all from MSCI. Indices are unmanaged. An investor cannot invest directly in an index. They are shown for illustrative purposes only. Past performance is no guarantee of future returns. Real results may vary.
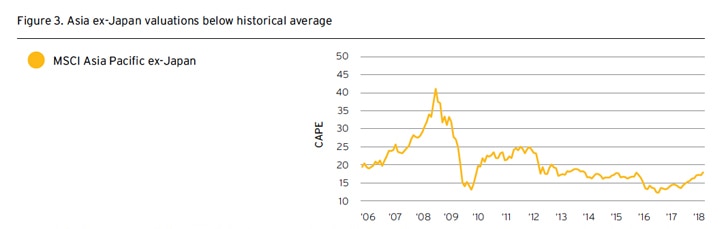
Source: MSCI, Bloomberg, as of 27 Nov 2017. CAPE is cyclically adjusted price to earnings: current price/10-year average real EPS. Std dev. = standard deviation, measuring the distance of valuations from their historical average. Past performance is no guarantee of future results. Real results may vary.
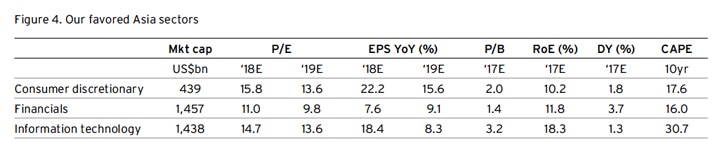
Source: Factset Consensus, MSCI, as of 24 Nov 2017. Note: The above data are compiled based on companies in MSCI AC World Index. The market capitalization for regions, markets and sectors are free float adjusted. P/E (Price/Earnings), EPS growth (Earnings per share), P/B (Price/Book), Dividend yield and RoE (Return on Equity) are aggregated from Factset consensus estimates. *CAPE stands for Cyclically Adjusted Price to Earnings, and is defined as: Current price/10-year average inflation adjusted EPS. Indices all from MSCI. Indices are unmanaged. An investor cannot invest directly in an index. They are shown for illustrative purposes only. Past performance is no guarantee of future returns. Real results may vary.
We also see South Korea as a market with substantial potential. Major political and corporate scandals, as well as an extended diplomatic spat with China weighed upon earnings in 2015 and 2016. But growth returned to South Korea in 2017, as political conditions calmed under the new president and the relationship with China began to improve. Tension with North Korea remains, but we expect neither resolution nor military escalation. As such, we believe that the South Korean economy is poised for higher growth. With the lowest valuation in the region, the country’s equity market may have an opportunity to narrow its discount in 2018.
Indian and Indonesian equities were previously among our favored markets. While we continue to see long-term potential in these economies, their equity markets already reflect this. India, for example, has seen 2017 earnings growth forecasts revised down substantially from 17% to 9%, but equity prices surged 25%, as domestic investors remained focused upon the prospects for further reform under Prime Minister Modi. These hopes may be realized, but the consensus earnings growth forecast remains at 19% for 2018, which leaves limited room for positive surprises.
In Japan, sharp increases in corporate earnings in 2017 prompted analysts to raise their forecasts substantially. However, equity market performance did not strengthen until the US dollar started to rebound against the Japanese yen in early September. Possible short-term US dollar appreciation, a recently announced fiscal stimulus program, and preparations for the 2020 Olympic Games could help drive this market higher in 2018. Beyond then, equity market gains look highly dependent on further dollar strength against the yen, for which we see only limited scope. As a result, we prefer to seek selective opportunities in Japan, such as in robotics, IT, and telecoms, where Japanese firms remain globally competitive.
Fixed income
Asia is likely to experience further monetary tightening in 2018, but less than the US. In 2017, certain regional central banks – notably China and South Korea – had a hawkish bias. Singapore, Malaysia and the Philippines are likely to tighten in 2018. India and Indonesia, on the other hand, still have room to ease policy. Overall, Asian central banks are likely to be more driven by local conditions, rather than by US monetary policy. This means investors have to be selective in their choice of fixed income markets across Asia.
Emerging Asian fixed income markets in 2017 benefited largely from attractive valuations, fading China risks, and a broadening improvement in global economic fundamentals. Moreover, an 8% drop in the US dollar provided an additional boost to local currency fixed income performance, fueling local Asia sovereign bonds to gain 11.5% as of 27 November. US dollar denominated debt also managed to gain by 8.5% through the same period.
In external Asian bond markets, valuations have now become much less compelling. Average sovereign spreads over US Treasury yields have compressed 150 basis points (bp) over the last two years, to their tightest levels since 2012. Even spreads on US dollar investment grade (IG) corporates have compressed to historical low levels. Although considered the highest quality emerging market region, Asia’s external bond spreads appear rich to us.
Looking ahead, US dollar denominated Asian debt may be challenged by higher US Treasury yields. While this will likely weigh down on prices, improving fundamentals may drive spreads even tighter, providing some offset. Although Asian IG valuations appear relatively more attractive than US domiciled IG corporates, wider spreads in Asian high yield (HY) markets may provide more of a buffer. Indeed, Asia HY default rates have steadily declined over the last several years.
Look local
In our view, local Asian bond markets offer more compelling yield opportunities. The regional growth outlook is improving and lower inflation trends should allow central banks to maintain easy monetary policies. While nominal exchange rates have rallied for most Asian countries this year against the US dollar, our outlook remains positive. Return expectations should still be revised lower, but attractive carry and continued investment inflows may fuel further outperformance.
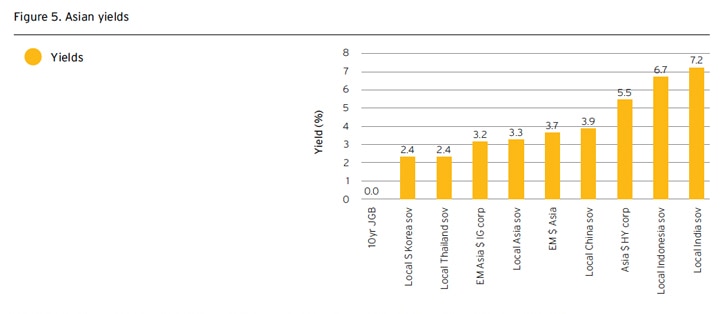
Our favored local markets include China, where higher yields have created an attractive opportunity. After rising 135bp over the last twelve months, 5-year sovereign bond yields have reached 3.9%, a three-year high. Rated A1/A+, real yields over 2.0% are some of the highest in the region – figure 5.
More notably, the launch of the ‘Bond Connect’ – a platform to provide access to local China bond markets through a Hong Kong exchange – is intended to open up China’s onshore bond market to the world. Considering just 4% of Chinese government bonds are owned by foreign investors, we would expect demand for local markets to grow over time. In turn, an increase in inflows can boost the currency and support lower bond yields.
We also maintain our high conviction in local Indonesian bonds, despite 12% gains through November 2017. Though 5-year sovereign yields have dropped 150bp, yields around 6.0% remain some of the highest in the EM universe. With inflation under control, central bank policy should remain relatively dovish in 2018. As such, we expect the nominal exchange rate to remain stable.
Local Indian debt has lagged somewhat, as economic momentum slowed. Concerns over wider fiscal deficits and increased bond issuance have also weighed upon local yields. That said, 5-year yields at 7% still remain attractive and represent the highest real yields in the region, while the macroeconomic deterioration has reversed. The Indian rupee and local rates are likely to be relatively more volatile over the coming year, but we remain encouraged by India’s longer term outlook and maintain our high conviction in the country.
Source: The Yield Book, as of 27 Nov 2017. Past performance is no guarantee of future results. Real results may vary.
Foreign exchange
Driven by US tax reforms, the US dollar could strengthen against EM Asian currencies for a time. In that scenario, the more sensitive currencies like the Indian rupee and Indonesian rupiah are likely to prove more vulnerable, while more managed currencies like the Chinese yuan, Taiwanese dollar, and Singaporean dollar are likely to show more resilience. In the longer term, EM Asian currencies may strengthen once more in the event of future weakness in the US dollar, solid external accounts, a stable to stronger yuan, and a relatively upbeat outlook for commodities.
The Chinese yuan was an anchor of stability for Asian currencies prior to 2015 and is likely to resume that function in the coming years. We believe the Chinese authorities intend to continue moving towards more market-determined pricing of the yuan. However, we think they will move gradually, taking account of prevailing market conditions, so as to limit extended one-way moves. That said, we expect the weaker dollar and greater investor inflows to China to support a generally stronger yuan over the coming three years.
We have a relatively upbeat view on commodities for 2018, which would be supportive of the currencies of commodity-exporting emerging market countries, particularly the Malaysian ringgit.

Other articles you might be interested in...


Related pages

Wealth Management – Structured products
LEARN MORE

Wealth Management - Bonds
LEARN MORE

Investing with Citibank | Investments
LEARN MORE
This document is distributed in Australia by Citigroup Pty Limited ABN 88 004 325 080, AFSL No. 238098, Australian credit licence 238098. Any advice is general advice only. It was prepared without taking into account your objectives, financial situation, or needs. Before acting on this advice you should consider if it's appropriate for your particular circumstances. You should also obtain and consider the relevant Product Disclosure Statement and terms and conditions before you make a decision about any financial product, and consider if it’s suitable for your objectives, financial situation, or needs. Investors are advised to obtain independent legal, financial, and taxation advice prior to investing. Past performance is not an indicator of future performance. Investment products are not available to US people and may not be available in all jurisdictions.